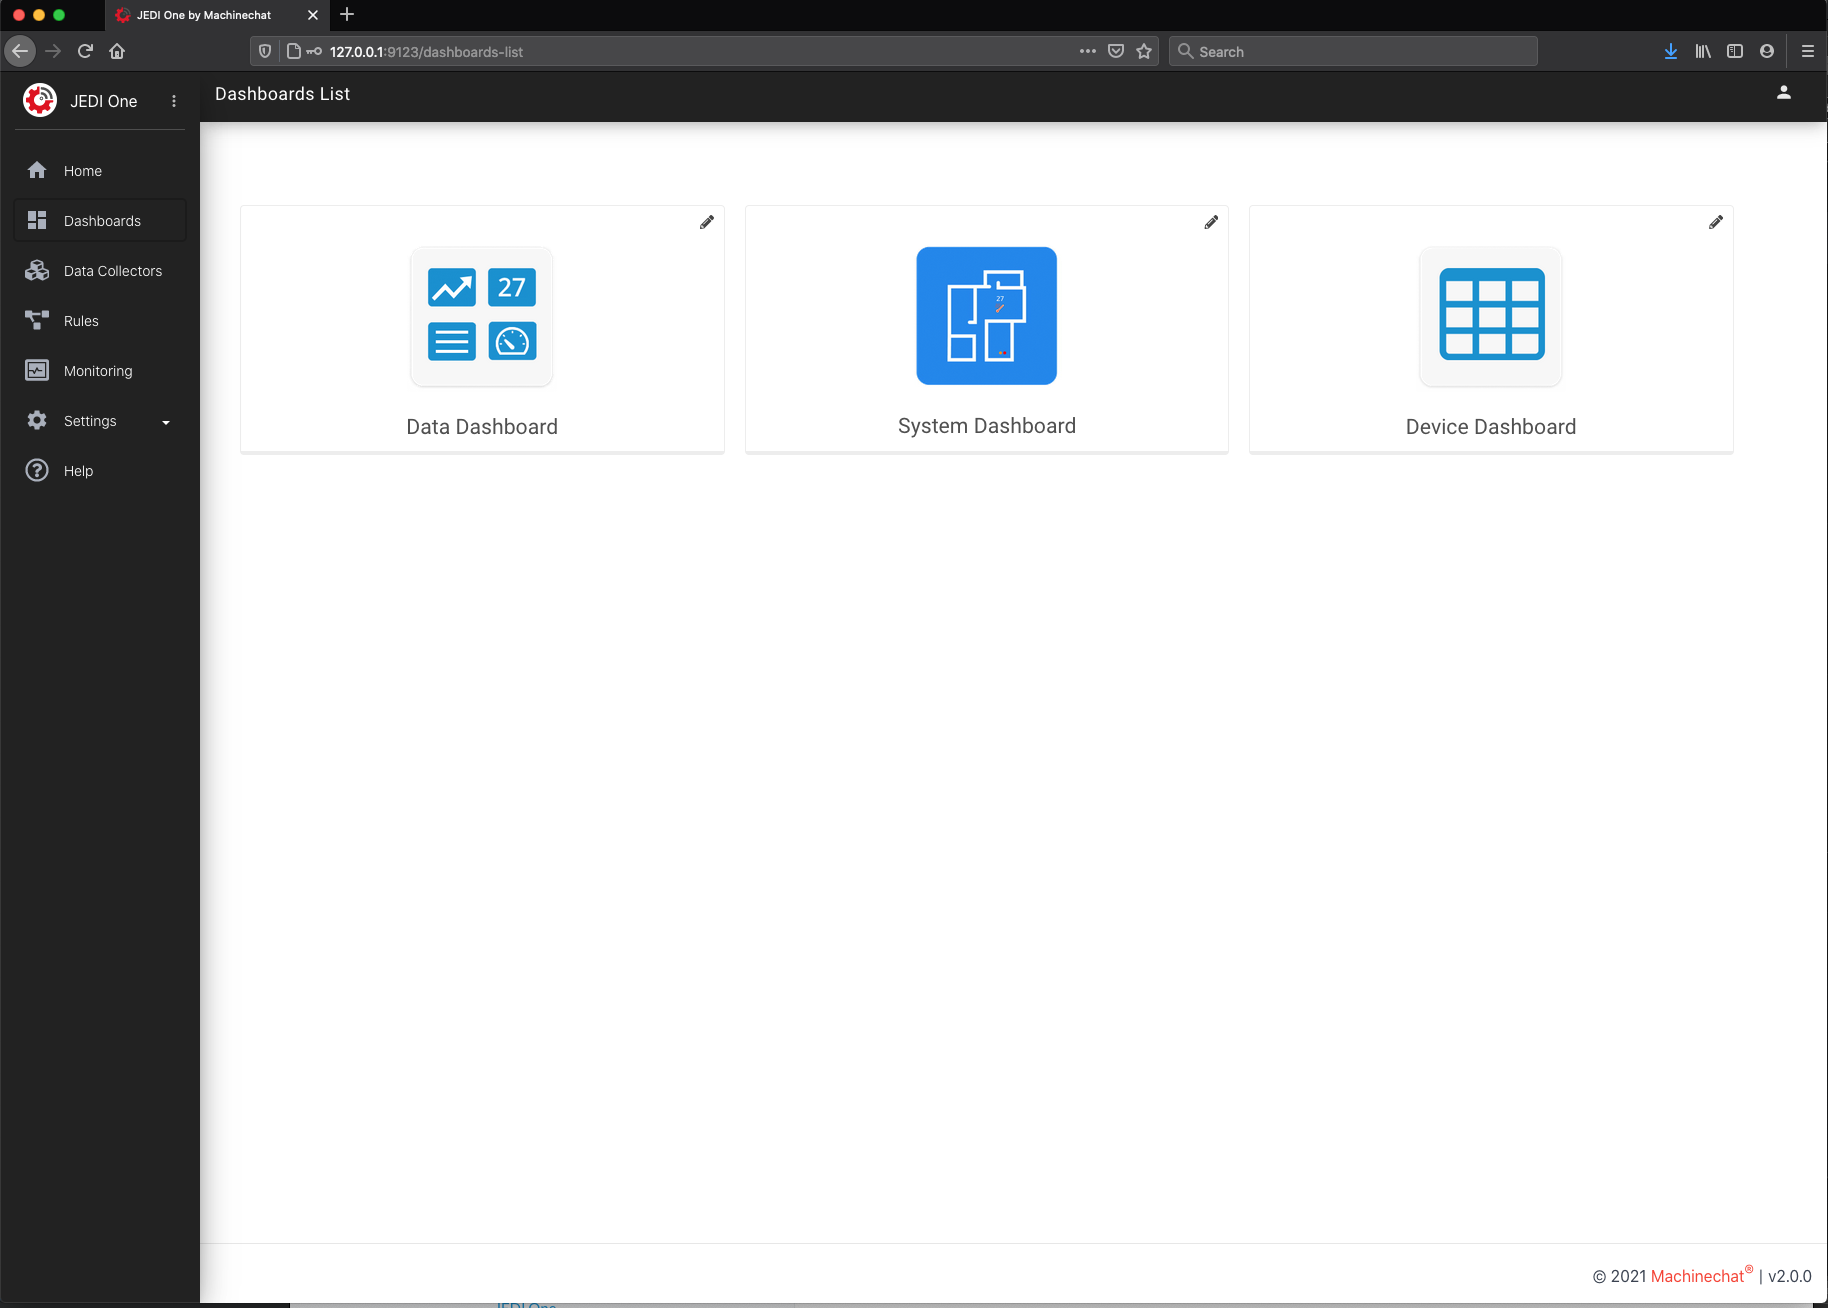
Device Dashboard presents a dynamic, single pane of glass view of all devices communicating with JEDI One. This gives an excellent overview of the connected devices and can also be a helpful IoT system diagnostic tool. By default it displays the Device ID and the Last Connected Time.
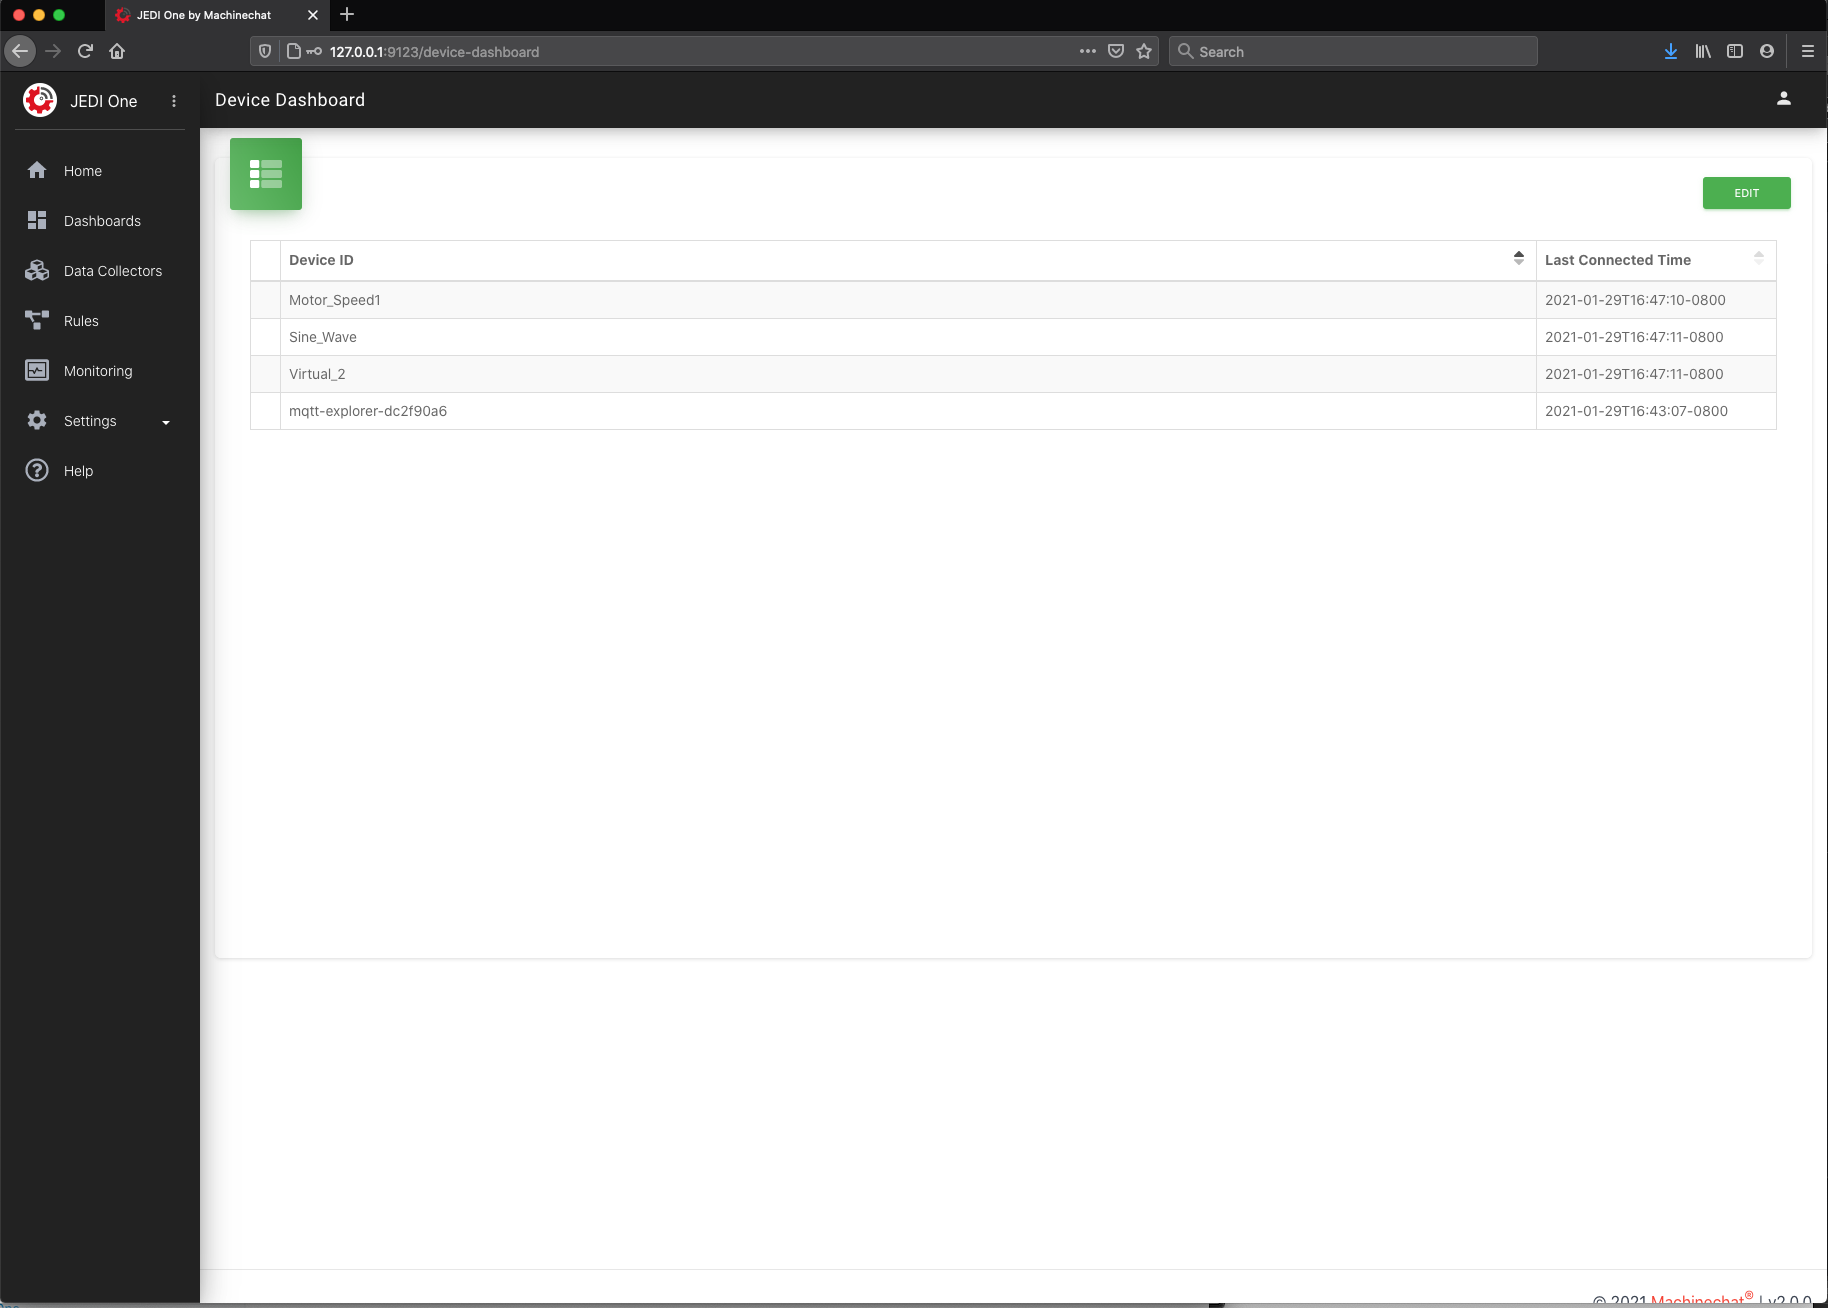
Clicking on "Edit" in the upper right hand corner allows adjustment of the refresh interval as well as the addition of up to 8 columns of properties (data from devices) which is dynamically updated.

Clicking on the up/down arrows at the top of a column sorts the entire table by that property in either ascending or descending value. Here's a short video of the Device Dashboard in action: