Data can be shown graphically by setting up dashboards. If possible, setup the data collectors first, then the data sources will be automatically listed. This video shows how to simply setup 2 charts:
Jedi One supports the following types of dashboards
- Data view
- System view
Data View
A data view dashboard allows viewing and adding charts that are organized on a grid. JEDI One provides several types of charts - choose the type that is appropriate for the data.

Adding a chart to data view dashboard
Select "Dashboards" from the JEDI One navigation menu, and then select "Data View".
To add the first chart to an empty data view dashboard, click "Add Chart" button. To add additional charts, click the "+" button in the top right hand corner of the data view dashboard.

- Enter a name for the chart
- Select a chart type
- Select a data source
- Select a property associated with the selected data source
- Enter the unit for the data. The unit will be printed on the chart
- Enter a refresh interval in seconds
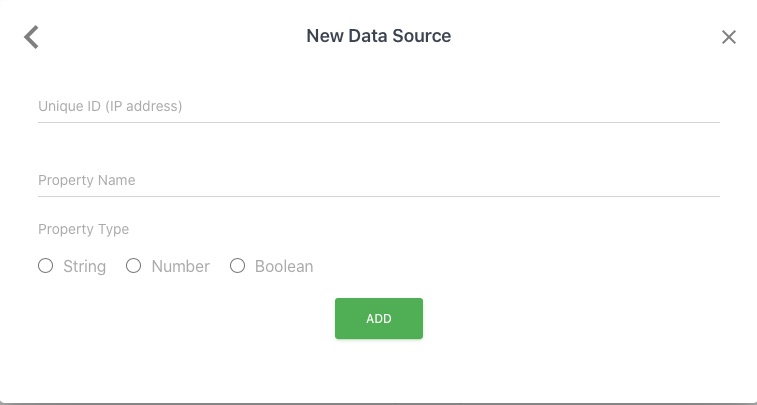
Adding a new data source
A data source must be specified for creating a chart or a rule.
When sensors, devices or machines connect to JEDI One (via HTTP, TCP CSV, or custom Plug-in), they are automatically added to the data source list in the new chart and new rule forms.
If a sensor, device or machine has not yet connected to JEDI One or sent data, add a data source manually using the "Add New Data Source" selection present in the source list for new chart and new rule forms.
Additional configuration may be required based on the selected chart type.
Chart types supported in Data View
- Line
- Area
- Tile
- Radial Bar Percentage
- Gauge
- Data Table
Line chart
Line charts are best suited for observing trends in live and historical data:

Area chart
Area charts are similar to line charts except for their visual appearance:

Understanding line and area chart controls
JEDI One provides several controls to interact with a chart. Some controls are common across all charts supported in data view dashboard.

- History mode: Switch to history mode. Select a data range, the down-sampling type and resolution
- Reload chart: Forces reloading data from JEDI One
- Zoom out
- Zoom in
- Edit chart: Edit an existing chart's configuration
- Delete chart
Selecting data range for viewing history

History view controls

- Zoom cursor: Select an area of the chart and zoom in
- Undo zoom: Undo previous zoom operation
- Download image: Download the current chart as a PNG image file
- Download CSV: Download the current char data as a CSV file
- Live mode: Switches the chart back to live data mode
- Down-sampling type: Adjust the data sample size that is shown in the chart on the JEDI One dashboard. In the screenshot, down-sample by mean and resolution by minute tells JEDI One to only display the mean of the data computed over one minute
- Down-sampling resolution Change the time period over which the down-sampling method/type will apply
Note: Setting down-sampling type to none can negatively affect performance if the selected date range spans multiple days and there are many data points to load
Tile chart
Tile charts are best suited for displaying instantaneous data:

The chart configuration can be edited to customize the icon, high value threshold, low value threshold, color of text for each threshold and offers a blink control for the text when the value crosses the configured thresholds.
Radial Bar Percentage
Radial Bar Percentage charts are best suited for displaying a data value as a percentage of a whole:

The chart configuration can be edited to set the maximum value used by the chart to compute the percentage.
Gauge
Gauge charts are best suited for displaying the current data value on a scale from zero to a configured maximum value:

Edit the chart configuration to set the maximum value used by the chart.
Data Table
Data table charts are best suited for displaying a group of data values as a table:

Edit the chart configuration to customize the column headings, and add multiple data rows.
System View
System view dashboard allows the importing of a background image and overlaying of data widgets on top of the image. JEDI One ensures that the widgets retain their positions on the background image when the browser window is scrolled, resized or minimized. The System View dashboard is useful for visualizing data in its enterprise environment.

- Widget palette
- Background image
- Number widget
- Liquid widget
- Gauge widget
Widget types supported in System View
- Text (Label)
- Number
- Liquid
- Gauge
To import a background image, click the background icon in the widget palette.
Add widgets by clicking the appropriate icon in the widget palette. Select the data source and property.
To resize the widget, click on the widget and use the handles on the sizes to resize the widget.
To move the widget, click the widget and use the blue handle on the top right hand corner to move the widget around.
To delete the widget, click the widget and then click the red trash bin icon.